
Tools
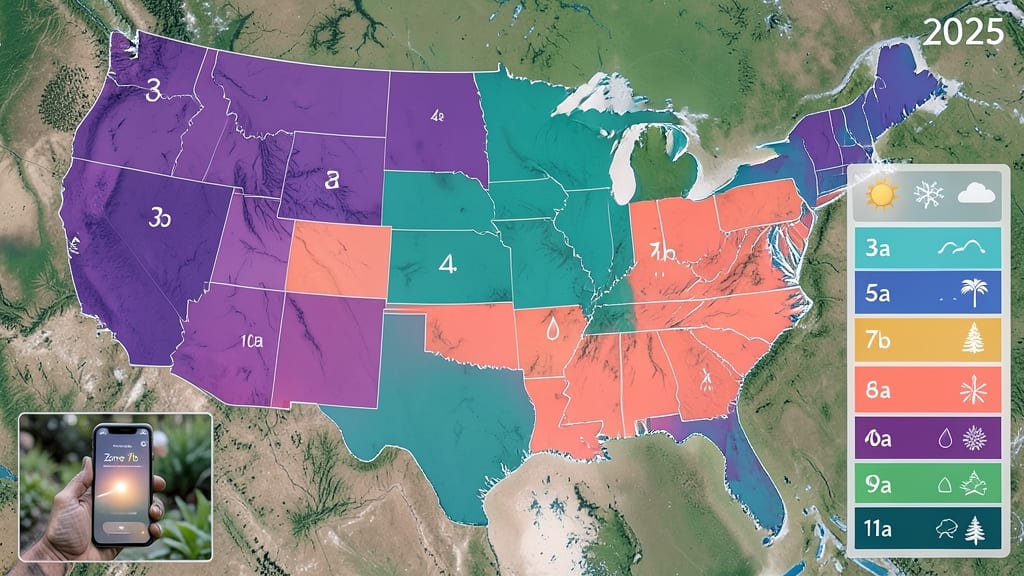
To determine what garden zone you're in for 2025, use the updated USDA Plant Hardiness Zone Map, which classifies regions based on average annual minimum temperatures. Simply enter your ZIP code or address to find your specific zone for accurate planting advice.
Your garden zone in 2025 isn't just about where you live—it's about how your local climate supports plant growth. The USDA updates these zones every few years to reflect shifting temperature patterns, and 2025 reflects warmer average lows in many regions due to climate change.
For example, a zone 7b area in 2020 might now be classified as 8a in 2025, meaning you can grow plants that previously struggled in your area. 🌱 This shift affects everything from vegetable planting times to which perennials will thrive year-round.
What makes this especially useful is how the map accounts for microclimates—small areas with unique conditions, like urban heat islands or sheltered valleys. While your ZIP code gives you a general zone, factors like elevation or nearby water bodies can create pockets where temperatures differ slightly.
That's why gardeners often test their own conditions by observing which plants survive winter best in their specific spot.
💡 In This Article
- How USDA Plant Hardiness Zones Are Calculated
- Step-by-Step Guide to Finding Your 2025 Garden Zone
How USDA plant hardiness zones are calculated
The USDA Plant Hardiness Zone Map relies on 30 years of temperature data from weather stations across the U.S. to calculate average annual minimum temperatures. Scientists analyze these records to determine the coldest temperatures plants can survive in a given area.
For example, zone 5a experiences -20°F to -15°F, while zone 9b ranges from 25°F to 30°F. This data is updated every few years to reflect climate shifts—2025's map shows warmer zones in many regions due to rising global temperatures.
Climate modeling plays a critical role in these updates. Researchers use sophisticated algorithms to project future temperature trends, accounting for factors like urbanization (which creates heat islands) and ocean currents. For instance, coastal areas may shift zones faster than inland regions due to milder maritime influences.
The 2025 map incorporates 5-year rolling averages to smooth out short-term fluctuations, ensuring accuracy for long-term gardening planning.
What's fascinating is how these zones shift over time. In just 10 years, some areas have moved one full zone warmer—meaning plants that once struggled in your region now thrive.
For example, Atlanta (historically zone 7b) is now classified as zone 8a, allowing gardeners to grow citrus trees that previously wouldn't survive winters. This shift affects everything from frost dates to which perennials return reliably each spring.
Microclimates add another layer of complexity. While your ZIP code gives a general zone, your actual yard might be 2-5°F warmer or cooler due to topography or local conditions.
For instance, a south-facing slope can be 5°F warmer than the surrounding area, creating a mini-climate where tender plants like bougainvillea might survive winters. That's why experienced gardeners often test their own microclimates by observing plant survival over multiple years.
Advanced gardeners also consider degree-day accumulations, which measure heat exposure over time. This helps predict when plants will bloom or fruit based on cumulative warmth. For example, peach trees need 500-800 degree-days above 45°F to set fruit—a calculation that becomes more precise with updated zone data.
The 2025 map also accounts for extreme weather events, like sudden cold snaps or heatwaves. While average temperatures guide zone assignments, these events can still damage plants outside their typical range.
That's why the USDA recommends using zones as a starting point, not absolute rules—your local observations matter just as much as the map.